View CT Logfile
Use this option to view the Code Trace (CT) Log. The CT Log performs a trace on the business methods used in a function, and is a valuable troubleshooting utility. The location of the log is set in the server.xml file:
<logging><LoggingDirectory>Directory on the AppServer host</LoggingDirectory></logging>
Note: When Full Business Code Logging is enabled, the CT Logfile also traces the execution of customized code.
View CT Logfile
Field Descriptions
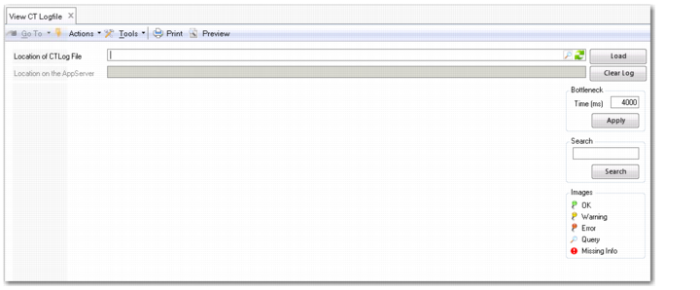
Location of CT Log file
Enter the location of the CT Log file. This file location is specified in the server.xml file <logging> parameter. With the lookup button you can open a log file from any location you choose. The Business Logging entry in the Appserver area of System Monitor details the location of the log file for your current session.
Load
Click to load the file.
Clear Log
Clears the CT Log file during an ongoing session for which the debug level is set. As a result, the system logs the business logic trace information.
When you click the Clear Log button, the viewer screen is cleared.
Location on the appserver
This field displays the appserver location when you load the file. The client and appserver may have different mappings to the same location. This is especially true when you use a UNIX server.
Bottleneck Time (ms)
Set a time in milliseconds after which an active business function is highlighted as a bottleneck. This lets you identify business functions that take a long time to complete and so may pose performance issues in the application.
Apply
Click to apply this bottleneck period to the log.
Search
Use this text search field to search the file for a text reference.
Images
Log entries are identified by the following types: OK, Warning, Error, Query, Missing Info.