Create a Report Analysis Code
To create report analysis codes, use Report Analysis Code Create (25.16.10.1).
Report Analysis Code Create
Header Section
The header section of Report Analysis Code Create contains two fields.
Analysis Code
Enter an alphanumeric analysis code. This field is mandatory. The field contains a lookup where you can check if your analysis code is in use. This facility helps to avoid duplication when you have many analysis codes.
Description
Enter an analysis code description. This field is mandatory. You can optionally enter descriptions in more than one language. For more information on the Translation Option, see
Introduction to QAD Enterprise Applications User Guide.
General Tab
The General tab contains the following fields:
Report Chart
Specify the report chart code. This field is mandatory, and must contain an existing report chart code. Financial Report Writer retrieves financial data from several source domains to form a common reporting COA. The report chart is composed of a GL account shared set, a sub-account shared set, a cost center shared set, a project shared set, and SAF concepts. It also includes the COA cross-references that translate the COA of the source domains to the report COA. The detailed elements of the report analysis code are based on the selected report COA.
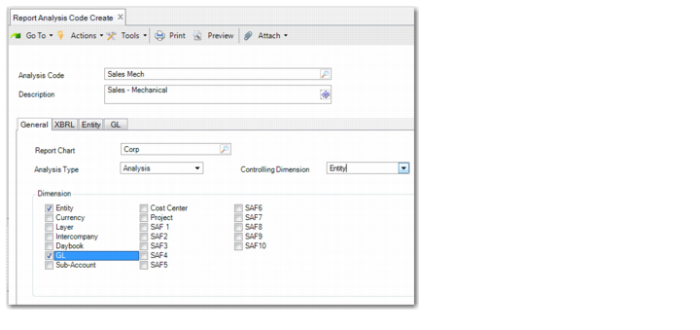
Controlling Dimension
Select a dimension as a controlling dimension. When generating reports, you can generate a report filtered on each value of the controlling dimension, which saves you having to generate each report individually.
The drop-down list for the Controlling Dimension field is populated based on the dimensions you select in the Dimension area of the General tab. For example, if you select fields for the GL, Sub-Account, and Daybook dimensions, these three options are available as controlling COA dimensions.
When running a financial report, you can specify an analysis code with a controlling dimension as a Filter Analysis code to control the bursting. You must also specify Yes in the Report Burst selection field in Financial Report Run. The report run then generates a separate report for each value of the controlling dimension. For example, if the analysis code has a controlling dimension of Entity, the report run generates reports for each entity.
Analysis Type
Specify the type of analysis code. This field is mandatory. There are four types:
• Analysis type analysis codes retrieve data from the cube according to specific selection criteria you enter on subsequent screens.
• Calculation type analysis codes contain calculations with other analysis codes.
• Sub-Total type analysis codes are used at a high level in the report hierarchy tree and summarize low-level nodes.
• Text type analysis codes contain labels that are printed on the report.
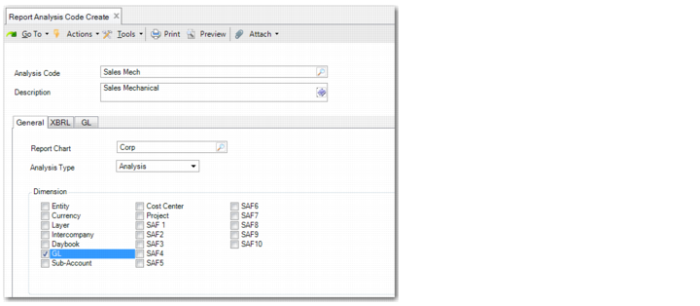
If the Analysis Type is set to Analysis, a list of dimensions to include is displayed. If you select a dimension to include, a new tab appears to enable you to enter details for that dimension, as shown in
Report Analysis Type: Analysis. A new tab is displayed for each dimension that you select. You can select as many dimensions as you need. The tabs are displayed in the order they logically appear in your chart of accounts.
Report Analysis Type: Analysis
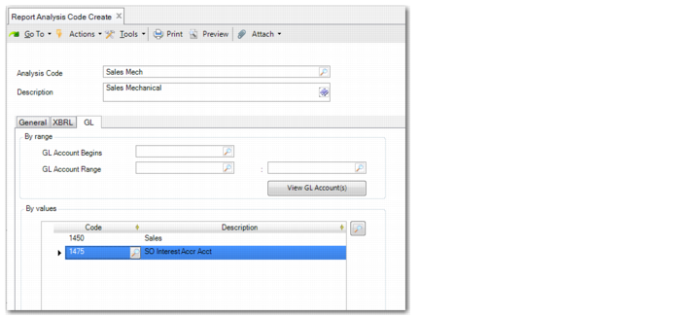
Each tab enables you to enter details for the dimension. You can enter the source dimensions by range or by value. In the example in
Report Analysis Type: Analysis Dimension, you add an analysis code dimension of type GL.
In the By range area, you can enter a GL account in the GL Account Begins field or you can enter a range of accounts in the GL Account Range fields. The advantage of entering a range is that the list of GL accounts in the analysis code dimension is dynamically updated when you add a GL account. You do not need to update the report analysis code dimension. The View GL Accounts button enables you to browse the list of GL accounts in the range. Click the lookup button on the right and use the Ctrl and Shift keys to multi-select the GL accounts in the range. To add the selected list of GL accounts to the dimension, press Enter.
In the example in
Report Analysis Type: Analysis Dimension, the GL accounts are entered by value. To enter accounts by value, insert a new row and select a GL account using the lookup browse. You can use the multi-select browse to add multiple GL accounts.
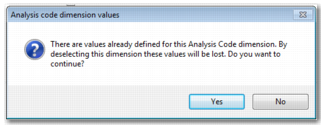
Note: If you have selected GL accounts and you enter a new range, a message is displayed warning you that selecting a new range will clear the current selection.
Although this example uses GL accounts, the functionality works the same way for any dimension you select on the General tab.
Report Analysis Type: Analysis Dimension
Important: If you clear an analysis code dimension field on the General tab or change the value in the Analysis Type field, a warning message is displayed, informing you that values are defined for this dimension and that these values will be lost. The values are not immediately lost if you click Yes. However, the values are deleted when you click Save
Report Analysis Type: Analysis Code Dimension Delete
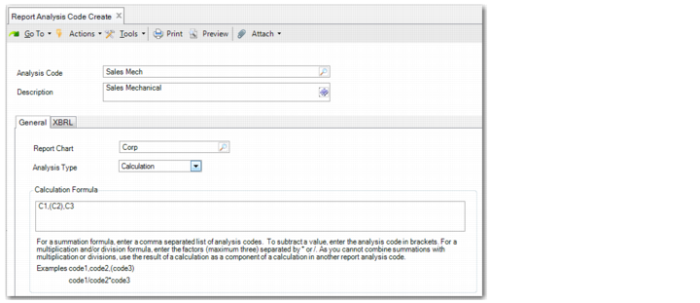
If you set the Analysis Type field to Calculation, the General tab is displayed with a Calculation Formula field, as displayed
Report Analysis Type: Calculation.
Report Analysis Type: Calculation
Calculation Formula
This field is only displayed when the analysis code type is Calculate. You can enter two types of calculations:
Summations: If you enter a list of report analysis codes, separated by commas, you can calculate the sum of balances. For example, C01, C02, C05 results in the sum of report analysis codes C01 + C02 + C05. In this type of calculation, you can also subtract. To subtract, place the report analysis code in parentheses. For example, C01, (C02), C05 results in the sum of report analysis codes C01 – C02 + C05.
Multiplications or divisions: You can enter a maximum of three factors separated by * or /. For example, to calculate C01/C02*C05, the system first divides C01 by C02 and then multiplies the result by C05. You can also use constants. For example, to calculate C01/C02*100, the system first divides C01 by C02 and then multiplies the result by 100. This method is useful for percentage calculations.
Cascaded Calculations
You cannot combine summations and multiplications or divisions in a single calculation report analysis code. However, you can use the result of a calculation as a component of a calculation in another report analysis code.
Example: Report analysis code C04 of type Calculate has the formula C01, (C02), C03 and report analysis code C06 of type Calculate has the formula C04/C05*100. The result in C06 = ((C01 – C02 + C03)/C05)*100).
You cannot use parentheses in multiplication or division calculations. However, you can circumvent this restriction using cascaded calculations.
Example: If you want to calculate C05 = C01/(C02*C03), parentheses are not allowed in the formula. C05 = C01/C02*C03 does not give the correct result because this calculation first divides C01 by C02 and then multiplies the result by C03. Therefore, you must create C04 = C02*C03 and then C05 = C01/C04.
Be careful not to create circular references when using cascaded calculations.
C04=C01*C02, C05=C03/C04, and C02=C05/C06 are not allowed in the same report tree. The value of C02 depends on the value of C05 (last calculation) and, similarly, the value of C05 depends indirectly on the value of C02 (the first two calculations). Circular references cause the report run program to abort with an error message.
XBRL Tab
Taxonomy Name
Specify the name of the taxonomy that applies, and to which the report analysis code belongs. There are multiple XBRL taxonomies, such as IFRS XBRL and US GAAP XBRL. Each taxonomy has specific structures and element naming conventions.
ELR
Specify the ELR code that identifies the report structure in the taxonomy. In each taxonomy, subdivisions are used to target reporting subareas with their own relational structure and label structure. These subdivisions are referred to as Extensible Linkbase References (ELRs). An ELR can relate to a single report.
XBRL Element
Specify the XML element name tag used in the XBRL taxonomy. For example, each balance row in the IFRS-XBRL taxonomy has a unique XBRL element name as an identifier, such as AssetsAbstract.