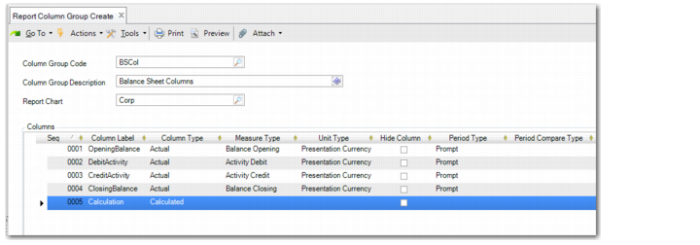
Report Column Group
The Financial Report Writer produces reports that can have up to 99 columns in the setup and report generation logic. However, the standard layout of the printed output has up to 16 columns predefined. If you want to create a report with more than 16 columns, add the required additional columns using the Report Resource Designer tool. You can define the number of columns, the content of each column, and the presentation details in Report Column Group Create (25.16.12.1).
For information on the Report Resource Designer tool, see
QAD Reporting Framework User Guide.
When you create a column group, you can use it as part of the report master record that you create using Report Master Create. You can create as many column groups as you need. Each column group is linked to a report chart because you can specify a report analysis code as the detailed element of a column, and report analysis codes belong to a report chart.
When you open Report Column Group Create from the menu, the screen in
Report Column Group Create opens:
Report Column Group Create
Column Group Code
Enter a maximum of 20 characters for a code to identify the column group.
Column Group Description
Enter a description of the column group. You can enter a maximum of 40 characters. You can optionally enter descriptions in more than one language. For more information on the Translation Option, see
Introduction to QAD Enterprise Applications User Guide.
Report Chart
Enter a report chart code. The code must reference an existing report chart.
Grid Fields
Right-click to insert rows in the grid. You can define column information on the grid line or you can double-click on the grid line and open a child window where you can define the column data. See
Report Column Group Create, Child Window.
Sequence
This field contains the column sequence number. You can specify up to 9999 columns. The first row that you create in the grid is assigned the sequence 001.
Important: You can rearrange the sequence of rows by selecting, dragging, and dropping the rows. The system re-sequences the new row order. See
Moving and Resequencing Columns.
Column Label
Specify a maximum of 20 characters for the label to print above the column on the report. You can enter plain text and use special variables as part of the text. The special variables are:
• FY#: From Year
• FP#: From Period
• TY#: To Year
• TP#: To Period
• FQ#: From Quarter
• TQ#: To Quarter. Periods are mapped to quarters using a fixed logic. Periods 1 to 3 map to Q1, periods 4 to 6 map to Q2, periods 7 to 9 map to Q3, and periods 10 to 12 map to Q4.
When you run the report, the variables are replaced by the report year and the period details you specified on the prompt page. The variables can also be replaced by the year and period, as calculated when comparing results with past GL periods.
Column Type
Specify the type of data that you want to display in this column. The options are:
• Actual: Select this option if the column will contain actuals posting data.
• Budget: Select this option if the column will contain Financials budget data. See
Financial Report Run.
• Calculated: Select this option if the column will contain a calculated value. If you select this option, you must enter the calculation formula in the Formula field.
• Forecast: Select this option if the column will contain forecast data from a Financials budget. See
Financial Report Run.
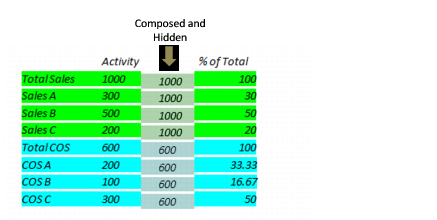
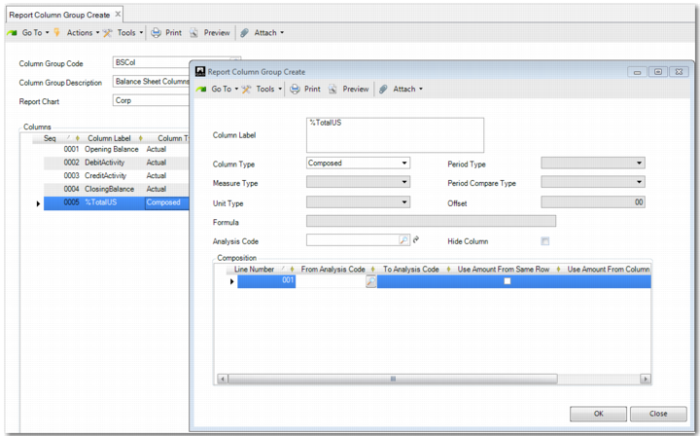
• Composed column type: Select this option when the column will contain data from a calculate operation involving multiple ranges of analysis codes in the tree. For each range, you can specify which column the amount is to come from and whether the value comes from the same row or from a specific analysis code. This type is generally used for calculations on reports that vary from section to section to compare details as a percentage of various sub-totals. A composed column is generally hidden on the report.
Example: In the example in
Composed Column Example, the last column % of Total displays the % compared to Total Sales for the first part of the report. It displays the % compared to Total COS for the second part of the report. You can produce this report by inserting a hidden column of type Composed that contains the value of Total Sales (1000) on all the rows of the first part of the report, and the value of Total COS (600) for all the rows in the second part of the report. The last column is a simple calculation dividing the values of the first column by the values of the second column and multiplying by 100.
Composed Column Example
Measure Type
Specify the type of balance that you want to display in this column. You can choose from Balance Opening, Balance Opening Debit, Balance Opening Credit, Activity, Activity Debit, Activity Credit, Activity YTD, Balance Closing, Balance Closing Debit, Balance Closing Credit, Calculated.
• The Balance Opening types provide the opening balance at the beginning of the reported period (From Year and From Period).
• The Balance Closing types provide the closing balance at the end of the reported period (To Year and To Period).
• The Activity types provide the activity during the complete reported period (From Year/Period - To Year/Period).
Note: When you define a column as YTD activity, the column in the report automatically contains the activity since the start of the year up to and including the To period that you select when you run the report.
Unit Type
Specify the currency in which to represent the amounts in the column. The options are:
• Presentation Currency: Select this option if the report column must display amounts in the presentation currency of the report cube.
• Base Currency: Select this option if the report column must display amounts in the currency that is mapped to the presentation currency in the report cube.
If you built the cube with the base currency calculating to the presentation currency, the base currency is used.
If you built the cube with the statutory currency calculating to the presentation currency, the statutory currency is used.
• Quantity: Select this option if the report column must contain quantities posted on GL accounts defined with quantity analysis.
Period Type
This field indicates which period data to include in the column. There are five period types:
• Prompt
• Compare
• Quarter
• Compare Quarter
• Fixed
When you select Prompt, the column contains data for the year periods entered on the prompt page when running the report. For example:
• You run a report for 2013/01–2013/03. The measure type is Activity. The column contains the activity for the period 2013/01–2013/03.
• You run a report for 2013/01–2013/03. The measure type is Balance Opening. The column contains the opening balance at the beginning of 2013/01.
• You run a report for 2013/01–2013/03. The measure type is Balance Closing. The column contains the closing balance at the end of 2013/03.
When you select Compare, the column contains data from a prior GL period you want to compare with. Instead of showing the activity or balance for the report period entered on the prompt page, the program displays the balance of a previous reporting period. To define the prior period to report on, use the Compare type and Offset fields.
When you select Quarter, you can put columns with quarterly totals next to columns with monthly totals on the same report. Assuming your cube has months as periods, system logic translates the From Period entry to the corresponding quarter.
For example, period 2 belongs to quarter 1, period 8 belongs to quarter 3, and any period from 10 up to 14 belongs to Q4. The To Period entry belongs to a To Quarter in the same way. Therefore, if you run a report from period 1 to period 3, the report displays the results of Q1 in the Quarter column. However, if you run a report from period 3 to period 3, the report also displays the results of Q1 in the Quarter column. This enables you to produce a report with a column displaying last month’s figures and another column with figures from the last quarter next to it. If a cube has only four periods, the period and quarter are treated as equal.
When you select Compare Quarter, you can also put columns with quarterly totals next to the previous quarter’s totals on the same report. The number of quarters entered in the period offset is subtracted from the calculated quarter. For example, if system logic finds Q2 based on the period selected, Compare Quarter with an offset of 1 returns the figures of Q1. If the logic finds Q1, Compare Quarter with an offset of 1 gives the figures of Q4 the previous year.
When you select Fixed, you can define a report column with a fixed period linked to it and enter a fixed period range for the column. The report prints the amount for that period, regardless of the period entered on the report selection. For example, if you want to create a report showing the 12 periods of the year in 12 columns, you can use fixed period type for each of the 12 months. In the same report, you can still have a Year To Date (YTD) column. Only the YTD column corresponds with the period selection that you enter when you run the report. The other 12 columns always show the 12 months. Fixed periods that fall beyond the period selected on the report selection page are automatically hidden.
Period Compare Type
When the Period Type field is set to Compare, this field lets you indicate what values to compare with. The options are:
• Report Period: Compare with a previous report period. You can go back as many periods as there are in a report year.
• Report Year: Compare with a prior report year. You can go back as many years as you want, provided that there is data for that year in the cube.
Note: The ability to compare data is only available if the report cube also spans this time frame. For that reason, it is recommended that you maintain report cubes with data that spans two report years. For example, if you maintain a cube with data from 2011–2012 and 2012–2013, you have data from the prior year to compare in the same cube.
Offset
When the Period Type field is set to Compare, this field lets you enter the number of periods or years you want to go back for the comparison. For example, for a column, you specify:
• Period Type = Compare
• Compare Type = ReportPeriod
• Offset = 3
You then run a report for 2013/01–2013/03 and the measure type is Activity. The comparing column contains the activity for the period 2012/10–2012/12. When running the report, the program goes back three report periods relative to the selected period.
Formula
If you specify Calculated in the Measure Type field, enter a calculation formula in this field. Calculations are always performed using the values from other columns or using constants. The reference to a column in the calculation is in the format letter C followed by a column number with no leading zeros; for example, C9. Component columns must be part of the same column group. This restriction is not validated when you create the column group; only when you use the tree to run a report.
You can add a calculation that references a report analysis code to a Financial Report Writer column. See
Calculations using a Report Analysis Code.
Analysis Code
This optional field allows you to specify a report analysis code, which is useful if you want to include side-by-side comparisons in the report. For example, to compare the balances of several entities, create a special report analysis code for each targeted entity and create a column for each entity that contains the corresponding analysis code. As a result, only the balances of the targeted entities are displayed in each column.
You can make comparisons for any dimension of the COA. You can compare entities, sub-accounts, cost centers, SAFs, GL accounts, layers, and other elements side-by-side in columns. The report analysis code must belong to the chart specified in the header of the report column group and the report analysis code must have only a single COA dimension; for example, only an Entity selection or only a Cost Center selection. You cannot use analysis codes that have two or more dimensions combined; for example, Entity and Cost Center selection.
Fixed Period From
Specify a fixed period from which the amount displayed is calculated.
Fixed Period To
Specify a fixed period to which the amount displayed is calculated.
Hide Future Periods
When you have fixed period columns, you can select this field to hide these columns that contain future periods compared to the period range selected at the prompt.
Example: You have 12 fixed periods columns on a report, one for each month of the year, and with Hide Future Periods selected. When you run the report and specify the period range 2014/01 to 2014/07 as the filter, columns for periods 08 to 12 are not printed on the report.
Hide Column
When you include columns in calculations, you may need an extra column to store an intermediate calculation result you do not want to display on a report. In this case, select the Hide Column field.
Zero Suppress
You can choose to suppress zero in the maintenance for the report column group. If a column is set with zero suppress, the zero amount is blanked out in the result of report run. Otherwise, the zero amount is displayed.
Full Amount
Select this field to display amounts in full.
Sign (%, $, ...)
You can enter a currency sign, currency code, or percentage sign of up to three characters. When you enter %, the related amount is multiplied by 100. When you enter ‰, the related amount is multiplied by 1000. When you enter PC#, the report cube presentation currency code is displayed in the report.
Sign Position
You can specify the sign to be leading or trailing after the amount.
Negative in Brackets
Select this field to display negative amounts in parentheses in this column.
Negative in Red
Select this field to display negative amounts in red in this column.
Label Style
This field enables you to control the alignment of the column label. This field is useful when you have a stacked label, which is a column label that spans more than one line. Possible values are center or left. The default label style is right-aligned.
Report Column Group Create, Child Window