Daemon Functions
Use the following activities to maintain and control daemons:
• Configure
• Start
• Stop
• Clear Queue
• Monitor
Note: Separate to this Monitor activity for each daemon, the Daemon Monitor menu option allows you to monitor all daemons from a single screen. The Daemon Monitor also allows you to view the log file and set debug levels for a daemon, and to start and stop all daemons at once. See
Monitoring Daemons Collectively for more information.
These activities are the same for all of the daemons, except the XML daemon, which is described on
here, and the Report daemon, which is described on
here. In addition, the Scan daemon has an extra grid, described on
here.
Both the Configure and Monitor activities check the status of the daemon and correct it before displaying. For example, if the daemon status is set to Running but no daemon process is detected on the QAD Financials appserver, the status is reset to Inactive before the Configure or Monitor screens display.
Note: You configure, clear queues, and monitor the Report daemon in the same way as for other daemons. However, the Report daemon is stopped and started from within the .Net Report Service.
Configure
The Configure activity lets you configure maintenance information for the daemon, such as the login ID and password, in addition to the log file and start directory. For security reasons, you should use a dedicated daemon user name. The user name must have access to all domains and entities have role permissions to all component activities in the database.
Note: The activities controlled by the daemon must be included in the list of activities for the role assigned to the daemon user name.
The Configure activity also lets you define the time interval before the daemon checks its queue for new requests, indicate whether to record processed items for audit purposes, and set the number of records that the daemon should process in each run.
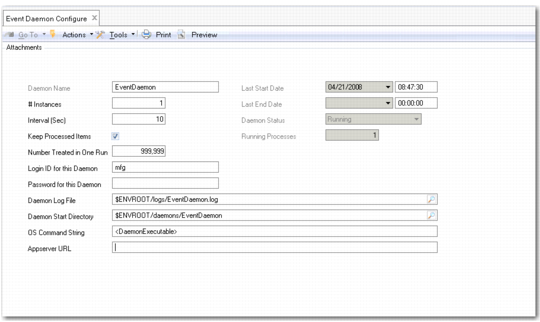
Event Daemon, Configure (36.14.16.1.1)
Field Descriptions
Daemon Name
Displays the daemon name.
# Instances
Enter the maximum number of instances that can be started for this daemon. It is possible to enter 0, meaning that the daemon is not configured for use in the system setup.
Interval (Sec)
Specify the time interval in seconds before the daemon checks its queue for new requests.
Keep Processed Items
Select the field to record processed items for audit purposes. When you clear the field, the system deletes all successfully processed requests from the Monitor screen. See
Monitor.
Note: It is recommended to clear this field for any daemons that process a high number of requests so that you can easily see requests processed with errors.
Number Treated in One Run
Specify the number of requests that the daemon should process in a single run. Note that during a run, the daemon does not react to Stop commands. If you set this number too high, the response time to a Stop command increases accordingly.
Login ID for this Daemon
Specify the ID of a valid active user that is assigned a role that grants permission to all activities and access to all domains and entities. To ensure proper security is enforced, the daemon process accesses the database by logging in with this name.
Note: The login details you specify are used by the Report daemon to determine the From address when you e-mail a report.
Password for this Daemon
Specify the password for the user ID in the previous field.
Important: If the password of this user is changed in User Maintenance, the change is not automatically reflected here. You must ensure that the passwords are updated in both places, or the Daemon process will fail on login.
Daemon Log File
Specify the full path of the log file in which the system records the daemon’s actions.
By default, the system uses the Environment Root variable $ENVROOT to specify the location of the daemon log file. The $ENVROOT variable takes its value from the serverXML file for the application environment, and ensures that the financial database can be copied between environments without the need to reconfigure the daemons.
The log file path by default is:
$ENVROOT/logs/<daemon name>.log
You do not normally need to modify this default.
To troubleshoot daemon activity, you can modify how messages are generated to the daemon log file by setting the debug level in the daemon configuration file. Each daemon has a configuration file of the form <DaemonName>.config in the PROPATH of the Financials appserver.
Example: To increase the message detail for the History daemon, modify the debug level in HistoryDaemon.config.
Daemon Start Directory
Specify the directory on the file system where the physical daemon process is started. Progress keeps its internal and temporary files related to the daemon process in this location.
The system also uses the Environment Root variable $ENVROOT to specify the location of the daemon start directory.
The start directory path by default is:
$ENVROOT/daemons/<daemon name>/
You do not normally need to modify this default.
OS Command String
Enter the physical command used to run an instance of the daemon. A part of this command string is determined by the application itself, and is referenced by using <DaemonExecutable>, and differs between operating systems. You can add parameters to the command, but should include the <DaemonExecutable> tag to refer to the actual executable.
Appserver URL
Enter the connection URL for the application server on which this daemon is to be run. You can optionally use a different server than the main application server.
Important: It is recommended that you define a different appserver connection for the Report daemon. This ensures that the batch processing of report requests does not have an impact on overall server performance.
Start Date of Last Daemon Run
This field displays the last time the daemon started.
End Date of Last Daemon Run
This field displays the last time the daemon stopped.
Daemon Status
This field displays the daemon status. Valid values are Inactive, Running, and Stopping. The Start and Stop activities control the status changes.
Number of Running Processes for this Date
Displays the number of instances of the daemon that are currently running. This value is zero when the daemon is inactive.
Start
The Start activity starts the daemon. The system displays a message that indicates that the daemon has started successfully.
Stop
The Stop activity stops the daemon.
The daemon stops after it completes its current task. Depending on the type of daemon and the amount of time it takes to complete an operation, some time may pass before the daemon detects the stop request and shuts down.
The system displays a message that indicates that the daemon has stopped successfully.
Note: The Start and Stop activities are not available for the Report daemon, which is managed by the .Net Report Service.
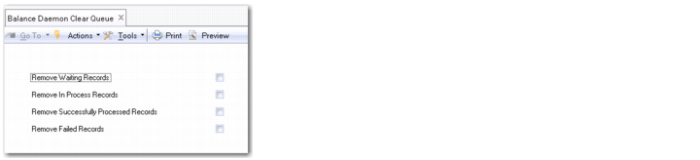
Clear Queue
Use the Clear Queue menu option to manage daemon queue requests. The records you select are immediately removed from the daemon queue.
Important: Only qualified and trained personnel should clear queues because this action can potentially destroy valuable information or interfere with critical application processes.
XML Daemon Clear Queue (36.14.16.6.2)
Field Descriptions
Remove Waiting Records
Select the field to remove records that are waiting to be processed from the daemon queue.
Remove in Process Records
Select the field to remove in-process records from the daemon queue.
Remove Successfully Processed Records
Select the field to remove successfully processed records from the daemon queue.
Remove Failed Records
Select the field to remove failed records from the daemon queue.
Monitor
There are two methods of monitoring daemons:
• Individually, using the Monitor menu option for the particular daemon.
• Collectively, using Daemon Monitor (36.14.16.25).
Monitoring Daemons Individually
The Monitor screen for a particular daemon lets you view the start and stop dates for the daemon and the requests that are processed, waiting, in progress, or incorrectly processed.
To access the monitor screen for a particular daemon, launch <daemon name> Daemon Monitor, where <daemon name> is the daemon name.
Event Daemon Monitor (36.14.16.1.3) displays the Event Daemon Monitor screen. The screen is composed of a header area and two grids.
The header area contains fields that display the daemon name, the start and end times, and the daemon status. The header also contains fields that let you choose the type of requests to include in the view.
The center grid of the Monitor displays:
• The start and end time of the request currently processing.
• A description of the request.
• The status of the request. The valid values are PROCESSED-OK, PROCESSED-ERR, WAITING, and IN-PROCESS.
Additionally, if you set a specific start date and time for the request, the center grid also displays this data. It is only possible to set a specific request date and time for the XML daemon.
The lower grid displays the error information for each request line, if any.
The view does not store correctly processed records after the next refresh unless the Keep Processed Items field is selected in the Configure screen.
Event Daemon Monitor (36.14.16.1.3)
Note: If a request does not process successfully, then the daemon automatically resubmits the request after a delay of 30 seconds. This resubmission can happen only three times per request. If the request is not processed successfully after three resubmissions, it will be marked as PROCESSED-ERR.
Field Descriptions
Daemon Name
Displays the daemon name.
Interval (Sec)
Displays the time interval in seconds before the daemon checks its queue for new requests. You can update this value using the Configure screen.
Include Waiting
Select the field to include waiting requests in the view.
Include Successfully Processed
Select the field to include correctly processed requests in the view.
Include in Process
Select the field to include requests that are in progress in the view.
Include Failed
Select this field to include incorrectly processed requests in the view.
Last Start Date (UTC)
This field displays the last time the daemon started.
Last End Date (UTC)
This field displays the last time the daemon stopped.
Daemon Status
This field displays the daemon status. The valid values are Inactive, Running, Starting, and Stopping. The Start and Stop activities control the status changes.
Running Processes
This field displays the number of instances of the daemon that are currently running. This value is 0 when the daemon is inactive.
Appserver URL
This field displays the URL of the appserver on which this daemon is running. The field is blank when the daemon is running on the main appserver.
Daemon Start Directory
This field displays the location of the daemon start directory, which the system retrieves from the daemon configuration.
# Waiting Requests/Number of waiting queues
Displays the number of records in the daemon queue that have the status Waiting.
Number of queue records
Displays the number of records in the daemon queue. This field displays in the Balance, Budget, Cross-Company, Cube, History, and Replication Daemon Monitor screens only.
Status Grid
Daemon Request Start Date
This field displays the date on which the daemon request was submitted.
Start Time
This field displays the time at which the daemon request was submitted.
Ref Description
This field displays an abbreviated description of the request type.
Ref
Request number.
Daemon Request Status
This field displays the status of the request. The possible statuses are: WAITING, IN-PROCESS, PROCESSED-OK, and PROCESSED-ERR.
Daemon Request End Date
This field displays the date on which the request was processed.
End Time
This field displays the time at which the daemon finished processing the request.
Locked Process
This field displays the ID of the process that is running the request. Some daemons can be run several times at once. Every time a daemon is started, a new physical Progress process is started.
Daemon Request Log
This field displays the date and time of the error together with the type of error.
Sequence
This field displays the order in which the requests should be handled.
Requested Start Date of Daemon
This field displays the requested start date for the daemon request.
If no start date is requested, the request will be processed as soon as possible.
Req Start Time
This field displays the requested start time for the daemon request.
If no requested start time or start date is specified, the daemon processes the request immediately. If no start time is specified, but the start date is, the request will be processed as early as possible on the requested date.
The Monitor screen for the Report daemon has two additional fields:
Socket Port.
This field displays the server port on which the .Net Report Service is listening for requests.
Socket Server.
This field displays the server on which the .Net Report Service is running.
These fields display values when the .Net report Service is running successfully. If the .Net Report Service is interrupted, these fields are blank. Errors in the .Net Report Service are displayed as Windows log events on the server on which the service is installed.
Note: To improve response times, the Monitor screen center grid for the History daemon differs from that of the other daemons. You can choose the default behavior, where one line appears in the grid for each request, or you can display multiple requests in a single line. To display multiple requests in a single line, set the Number Treated in One Run property of the History daemon configuration file to 999999. The CT log file for these grid lines contains less information than the CT log file for grid lines that appear in this screen during the default screen behavior.
Error Grid
Daemon Request Log
Displays the date and time of the error together with the type of error.
Field Label
Displays the label of the field that initiated the error.
Field Name
Displays the name of the field that initiated the error.
Field Value
Displays the value in the field that initiated the error.
Accompanying Error Message
Displays the message associated with the error.
Error Severity
Displays the severity level of the error.
Error Type
Displays E for error, I for informational, and W for warning.
Monitoring Daemons Collectively
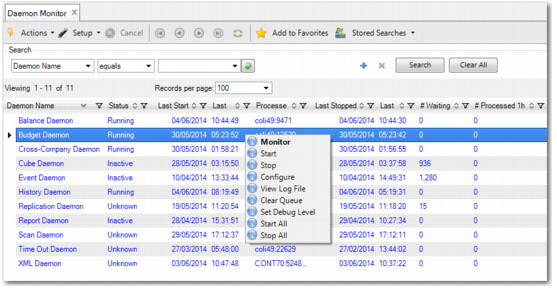
The Daemon Monitor screen (36.14.16.25) lets you monitor all daemons at once.
The screen is a browse with search criteria and a results grid. When the menu option opens, all daemons are displayed by default; use the search criteria to refine the results.
Daemon Monitor (36.14.16.25)
Search Criteria
By default, one search field displays. You can add more fields and use the drop-down menu in the search field to specify further criteria. The search criteria correspond to the column headings in the results grid.
Results Grid Columns
Daemon Name, Name, Status
The translated name, name, and status of the daemon. Possible statuses are Inactive, Starting, Running, and Stopped.
Last Started, Last Started (UTC), Last Stopped, Last Stopped (UTC)
The date and time that the daemon was most recently started and stopped.
Last Started By, Last Stopped By
The user who most recently started and stopped the daemon. If the daemon started or stopped as a result of an operating system script, then this information appears in the column as <system>.
# Instances
The number of instances of the daemon that are currently running. This value is zero when the daemon is inactive. This column corresponds to the Daemon Monitor search criteria # Instances and Running Processes.
Processes
For running processes, this column displays the name of the server that the daemon process is running on and the process ID. If multiple processes are running for the daemon, then this column displays a list of server names and process IDs.
# Failed, # Waiting, # Processed 1h, # Processed 24h
These columns display the number of instances of the daemon that have failed, are currently waiting in the daemon queue, were processed within the last hour, and were processed within the last 24 hours, respectively.
Daemon Log File
Displays the path to the log file for the daemon.
Daemon Log Level
This column displays information about the debugging options that are activated for the daemon. You can set these options in the Daemon - Set Debug Level screen, which is accessed by right-clicking a row in the status grid and choosing Set Debug Level.
The value of Daemon Log Level is initially 0, and increases by 1 when the first field in the Daemon - Set Debug Level screen is selected. It increases by 2 when the second field is selected, by 4 when the third field is selected, by 8 when the fourth field is selected, and by 16 when the fifth field is selected. For example, when the first and fourth fields in the Daemon - Set Debug Level screen are selected, then Daemon Log Level is 9.
Daemon Start Directory
The location of the daemon start directory, which the system retrieves from the daemon configuration.
Daemon Login
The user ID that the daemon used when logging in.
OS Command String
This column corresponds to the OS Command String field in the Configure screen for the daemon.
No in One Run
The value of the Number Treated in One Run field in the Configure screen for the daemon.
Keep OK
This column displays yes when the Keep Processed Items field in the Configure screen for the daemon is selected. Otherwise, this field displays no.
Interval
The time interval in seconds before the daemon checks its queue for new requests. You can update this value using the Configure screen.
Appserver URL
This column displays the URL of the appserver on which this daemon is running. The field is blank when the daemon is running on the main appserver.
To perform an activity on a daemon, select the daemon in the grid and right-click to see the following options:
• Monitor
• Start
• Stop
• Configure
• View Log File
• Clear Queue
• Set Debug Level
• Start All
• Stop All
The Monitor, Start, Stop, Configure, and Clear Queue activities are described earlier in this section,
Daemon Functions.
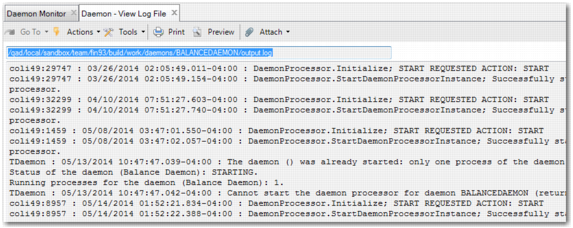
The View Log File option displays the log file for the selected daemon. For more information on the log file, see
View CT Logfile.
View Log File
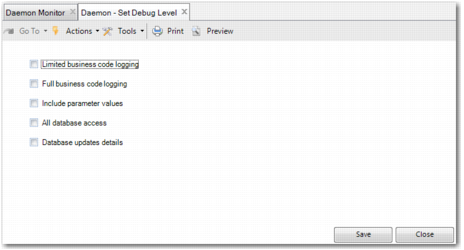
The Set Debug Level option lets you state the level of CT-logging that you want for the daemon. Selecting this option displays the Daemon - Set Debug Level screen. This screen is similar to the Set Debug Level screen described in
Set Debug Level, but it contains an extra Database updates details option.
Daemon - Set Debug Level
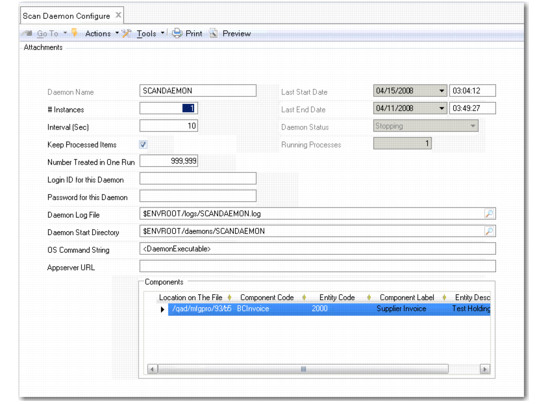
Configuring the Scan Daemon
The Scan Daemon Configure activity contains an additional grid for specifying the business component to be associated with a scanned document, the directory the daemon should monitor for documents, and the entity the scanned documents should be associated with.
Scan Daemon, Configure (36.14.16.4.1)
Field Descriptions
Component Code
Choose the name of the business component that the scanned document should be associated with. You can select only components that support the Save as Draft feature. Currently, this includes the following components:
• Banking Entry
• Business Relation
• Customer
• Customer Finance Charge
• Customer Invoice
• Journal Entry
• Petty Cash
• Supplier Invoice
• Supplier
Example: You specify BCInvoice, the technical name for a supplier invoice. The Scan daemon runs the Supplier Invoice Create activity when it detects a document to scan.
Documents for each scanned component must be located in a separate directory. The component description displays in the Component Label column.
Location on The File System
Enter the full path to the directory on the Financials appserver where documents to be scanned and associated with the specified component are located.
Important: Make sure the directory is on the correct server or it will not be found.
Entity Code
Specify the entity associated with the scanned documents.