Supermarket Workbench
Use Supermarket Workbench (17.2.7) to simulate the anticipated performance of an inventory supermarket based on future demand. Demand sources include forecast, sales orders, customer schedules, return material authorizations (RMAs), material orders, and intersite demand. For reference, the program calculates and displays level schedules, then calculates the buffer size at the end of each day based on the level schedule and demand for the day.
Color codes identify days when the buffer falls below specified levels. For example, if no buffer quantities have dropped below the critical limit, the supermarket might have too much inventory. See
Warning and Critical Limit Values.
You can simulate the effects of changing the buffer size on supermarket performance by entering a target buffer size, and use the results of the simulation to modify supermarket and kanban sizing parameters.
Optionally, you can view a graph of current and modified supermarket buffer size during the planning horizon period.
When you save your changes, the system updates kanban loop data in the following Kanban Master Maintenance (17.1.4) fields, as appropriate:
• Buffer Maximum
• Number of Cards
• Kanban Quantity
• Safety Stock
• Variability
Click Audit Report to review simulated changes before saving them to the database.
Note: This program is most useful when used to evaluate the effectiveness of supermarkets supplied by pacemaker processes, rather than by other supermarkets or external suppliers.
Use Historical Buffer Evaluation (17.2.2) to review the effectiveness of supermarket sizing based on actual, rather than simulated, performance. See
Historical Buffer Evaluation.
Prerequisites
Before evaluating future supermarket buffer performance with this workbench, be sure you have set up the following data:
• Kanban item records using Kanban Item Master Maintenance (17.1.1). See
Kanban Items.
• Manufacturing process definitions using Kanban Process Maintenance (17.1.3). See
Define Processes.
Using the Program
Important: Supermarket Workbench is designed specifically for the QAD .NET UI. Although the program displays as a menu item in other interfaces, it runs only in QAD .NET UI.
Supermarket Workbench consists of multiple frames, as well as several control buttons that display at the bottom of the program screen. Click the appropriate button to perform the following functions:
• Save: Click Save when you finish analyzing the effects of a supermarket size change and want to update the database.
• Refresh: Replace the workbench data with the original values from the database. If you have updated the Target Buffer Size field, the system prompts you to continue. If you continue the refresh without clicking Save, any changes you made in the workbench are lost.
• Recalculate: Update calculated fields based on changes you make to the Target Buffer Size field. This updates the workbench, but no changes are made to the database until you click Save.
• Audit Report: View a report comparing the baseline data with updates that will take place when you click Save. Use this feature to analyze the effects of your changes before modifying the database.
• Graph: Plot the current and target supermarket buffer quantities remaining over the specified planning horizon.
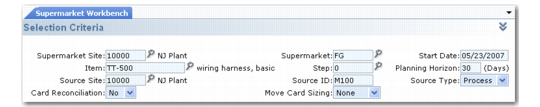
In the initial frame, select kanban loop records by entering a combination of site and other data to uniquely identify a kanban supermarket, as well as the start date and the number of days the system should include in the planning horizon.
You also can reconcile cards from within the workbench by setting Card Reconciliation to Yes in the Selection Criteria frame. The system compares the current number of active cards to the optimum number and displays the number of out-of-balance loops in the Reconcile/Print Cards frame. This is the same way card reconciliation works in the kanban workbenches. See
Reconcile Cards.
Supermarket Workbench (17.2.7), Selection Criteria Frame
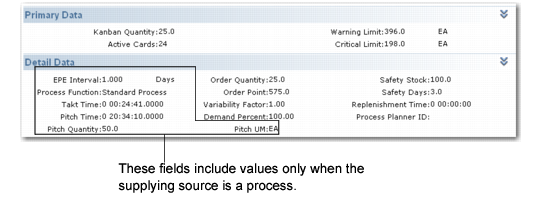
The system displays two frames of data based on the source type for the loop that supplies the selected supermarket:
• For all source types, the Primary Data frame shows the number of active cards and the kanban size, as well as the critical and warning limit levels set in Kanban Master Maintenance. These limits display as quantities, even when Limit Display is set to Pct in the kanban master record.
• For all source types, the Detail Data frame displays more information from Kanban Master Maintenance, including the order quantity, order point, variability factor, demand percent, safety stock, safety time, and replenishment time.
• Only for loops that are supplied by a process, the Detail Data frame also includes several values from Kanban Process Maintenance, including the every-part-every (EPE) interval for the item, process function, and takt time, as well as the pitch time, quantity, and UM for the process. For loops supplied by an external supplier or a kanban supermarket, these fields are blank.
See
Source Data for more information.
Supermarket Workbench, Primary and Detail Data Frames
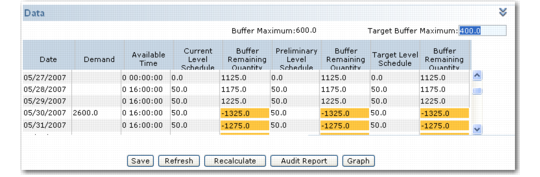
The Data frame at the bottom of the screen includes two fields.
Buffer Maximum
The system displays the current value of the Buffer Maximum field in Kanban Master Maintenance.
Target Buffer Maximum
You can update this field to analyze the effects of changing the buffer size. The default is the value of Warning Limit, rounded up based on the kanban quantity.
See
Buffer Maximum for more information.
Supermarket Workbench, Data Frame
The Data grid displays the information about the supermarket shown in
Supermarket Workbench, Data Grid Fields.
Supermarket Workbench, Data Grid Fields
Field | Description |
Date | The grid includes a row for each day in the planning horizon, beginning with the start date. |
Demand | The total of actual demand for the date plus daily forecast, calculated by prorating the weekly forecast over the number of active days in the week. Prorating for the current week assumes a Monday start date. |
Available Time | The total time available to produce the kanban item. When the loop is supplied by a process, this is derived from the Available Time field in Kanban Process Maintenance. Since level schedules are calculated only for processes, this column is not significant for other source types. |
Current Level Schedule | Based on demand and available time over the horizon period, as well as available time for the specific day, the system calculates the number of units to be produced on each day that the item is scheduled for production, rounded based on the kanban quantity. Not all items are necessarily scheduled for each day; for example, this is not possible if the EPE interval is greater than one day. |
Buffer Remaining Quantity | The system displays the quantity remaining in the supermarket each day after adding the current level schedule quantity and subtracting the demand. Note The Current Inventory row displays the result of multiplying the kanban quantity by the number of replenishment cards, with the exception of those with a status of Empty Accumulate. Those cards are not yet authorized based on accumulator settings in Kanban Master Maintenance. |
Preliminary Level Schedule and Buffer Remaining Quantity | These calculations use the same logic as the current level schedule, but adjust the level schedule based on the supermarket size specified in Buffer Maximum. |
Target Level Schedule and Buffer Remaining Quantity | These calculations adjust the level schedule based on the updated value of Target Buffer Maximum. |
Warning and Critical Limit Values
The system compares the values of Warning Limit and Critical Limit specified in Kanban Master Maintenance with the Buffer Remaining Quantity values. These values are displayed for reference in the Primary Data frame.
Note: If Limit Display is set to Pct in Kanban Master Maintenance, the system multiplies the Buffer Maximum value by that percentage to display the limits as quantities. When Limit Display is Quantity, the system displays the specified limits.
When the remaining buffer falls below a limit, the system color codes the buffer value for the day as follows:
• Yellow: The buffer level is below the critical limit.
• Orange: The buffer level has reached or fallen below 0 (zero).